Impactful creative is quickly becoming the most important driver of KPIs for marketing and brand teams. With government oversight trained on tech companies, brands that previously relied on rich performance data from social platforms struggle to revise attribution models and adapt to the marketing landscape in the precursor to Web 3.0. Creative Insights, the flagship product of Jove, cuts through the noise of digital channel reporting to surface meaningful insights, comparisons, and prompt next steps in creative generation and brand strategy.
Creative performance relative to brand pillars, creative strategy, audience composition, and many other esoteric marketing KPIs has always been a challenging and arduous task for marketers. Much of the tactical marketplace resorts to compiling performance data exported from digital ad platforms into a PowerPoint deck with screenshots of ads, anecdotal brand phrases, descriptions of lookalike audiences, and high-level financial investment.
Amassing this information from Facebook, Snapchat, TikTok, Pinterest, and other digital platforms exponentially increases the time and attention-to-detail needed to produce 30,000-foot views for executives and stakeholders who don't have the time to sort through the nitty-gritty. So much so, that the role of Marketing Analyst exists to collect, analyze, and synthesize channel data into a collective strategy to reach customers where they convert the most.
Creative Insights acts as the single source of truth for tactical marketers, analysts, designers, executives, and agile marketing teams to quickly see what ads are performing and understand what steps to take next. Enabling close collaboration in robust ad-testing campaigns to understand consumer sentiment and buying patterns, and interpret creative trends and brand strategy.
Tying creative data to marketing strategy
Surfacing marketing data in a cohesive and actionable fashion for all members of a team highlights additional challenges with the marketing industry as a whole. Not only is this data fundamentally complex and multivariant, but the visual stimulation of media and copy elements tend to compete with raw performance data and metrics.
"How do I view all of my top and bottom-performing ads and the attributes associated with them without digging through Facebook Business Manager for three hours?"
"How can I see which ads perform best based on a specific brand attribute or audience type so I can better remarket to customers who have already made a purchase?"
"What if I want to compare the cost-per-acquisition of my ads against the number of impressions they receive to know where I should invest more of my budget?"
"What are my competitors doing and how can I take inspiration from their ad creative and campaign spending to obtain a larger piece of the pie?"
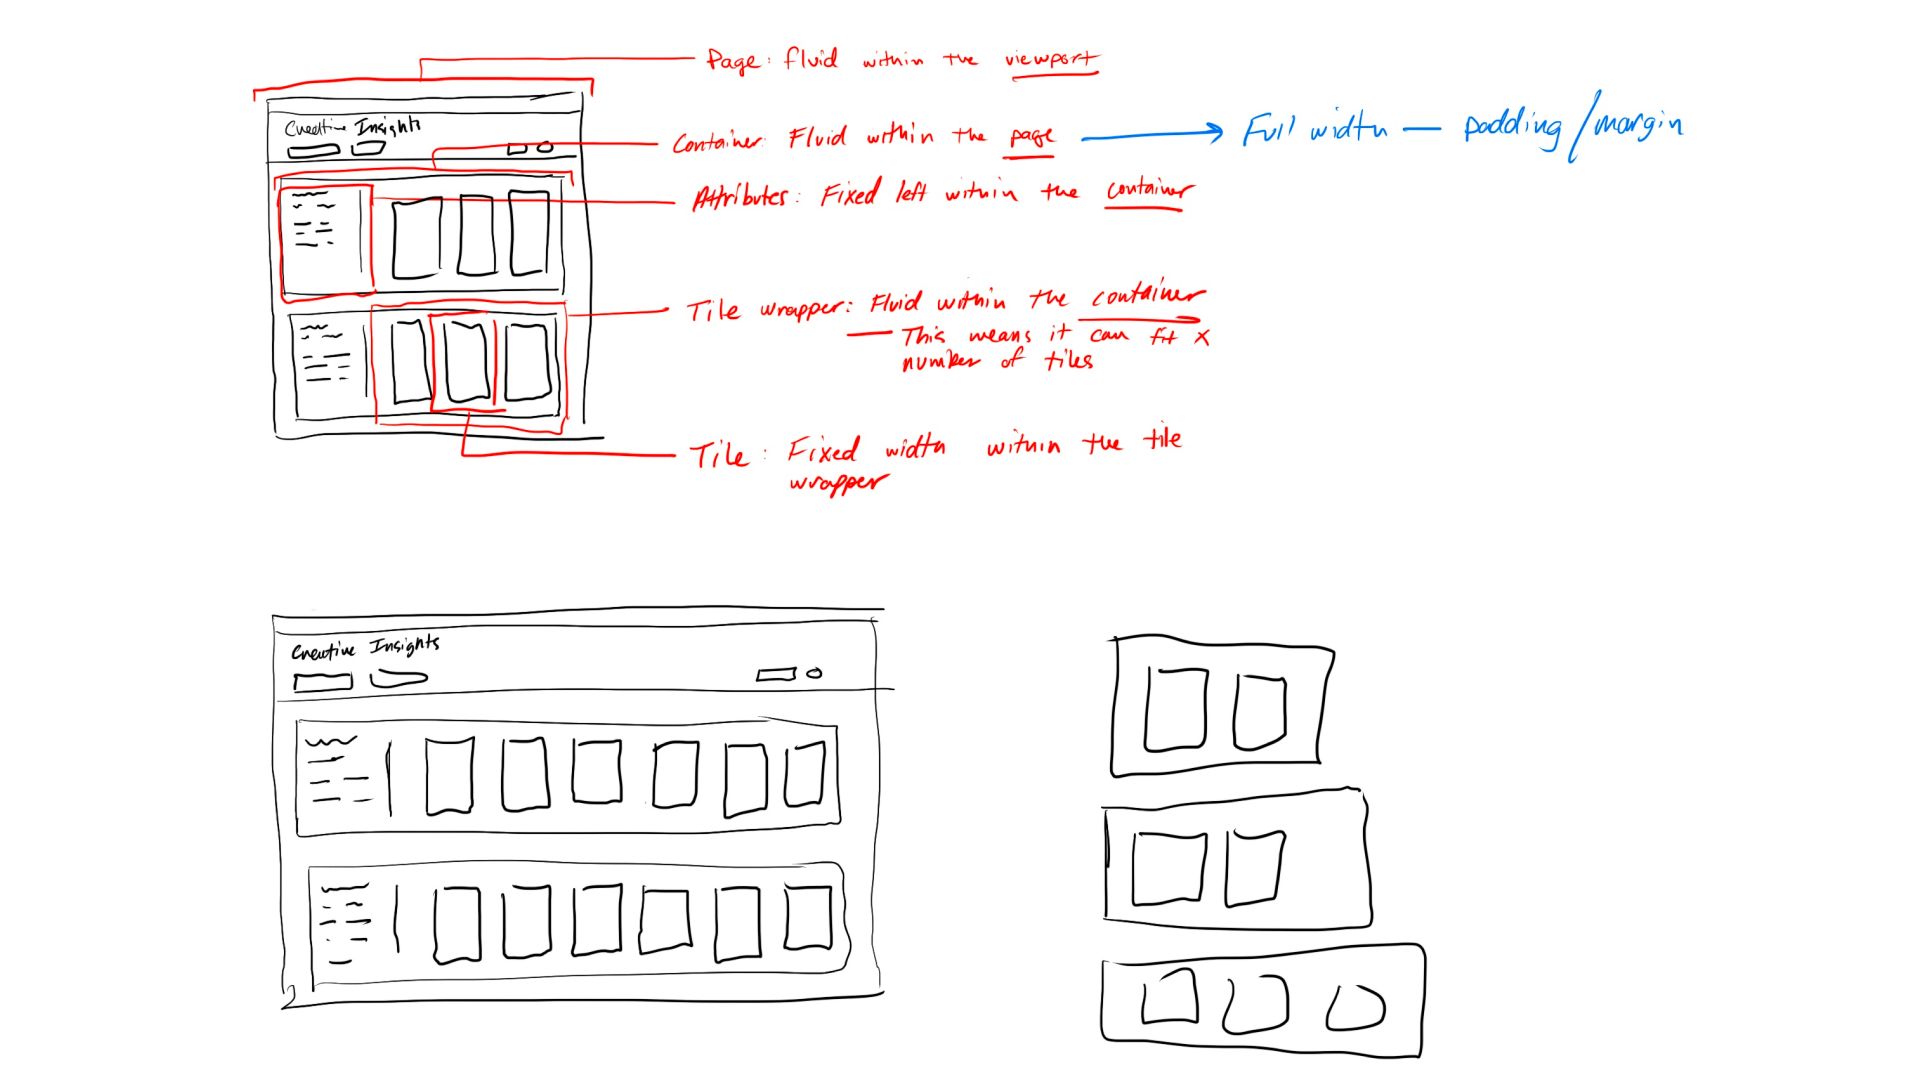
Fluid, yet cohesive architecture
The solution to these problems is not consistent across different marketing teams, rolls, and even within individual brands. Differences in complex attribution models, inconsistent campaign strategies, and the varying degrees of maturity within marketing teams makes it next to impossible to make assumptions about which data and information is most beneficial for marketers.
Breaking down marketing campaigns and creative into their core components and allowing users to reassemble them to their liking provided the greatest amount of flexibility and customization while sourcing from the same data lake.
Ad components
Ads in digital marketplaces contain a combination of elements that contribute to the holistic creative of the ad:
Media component: generally an image or video, but could be an interactive application for in-app advertising.
Copy component: expressing the value proposition and brand voice of a marketing team or brand.
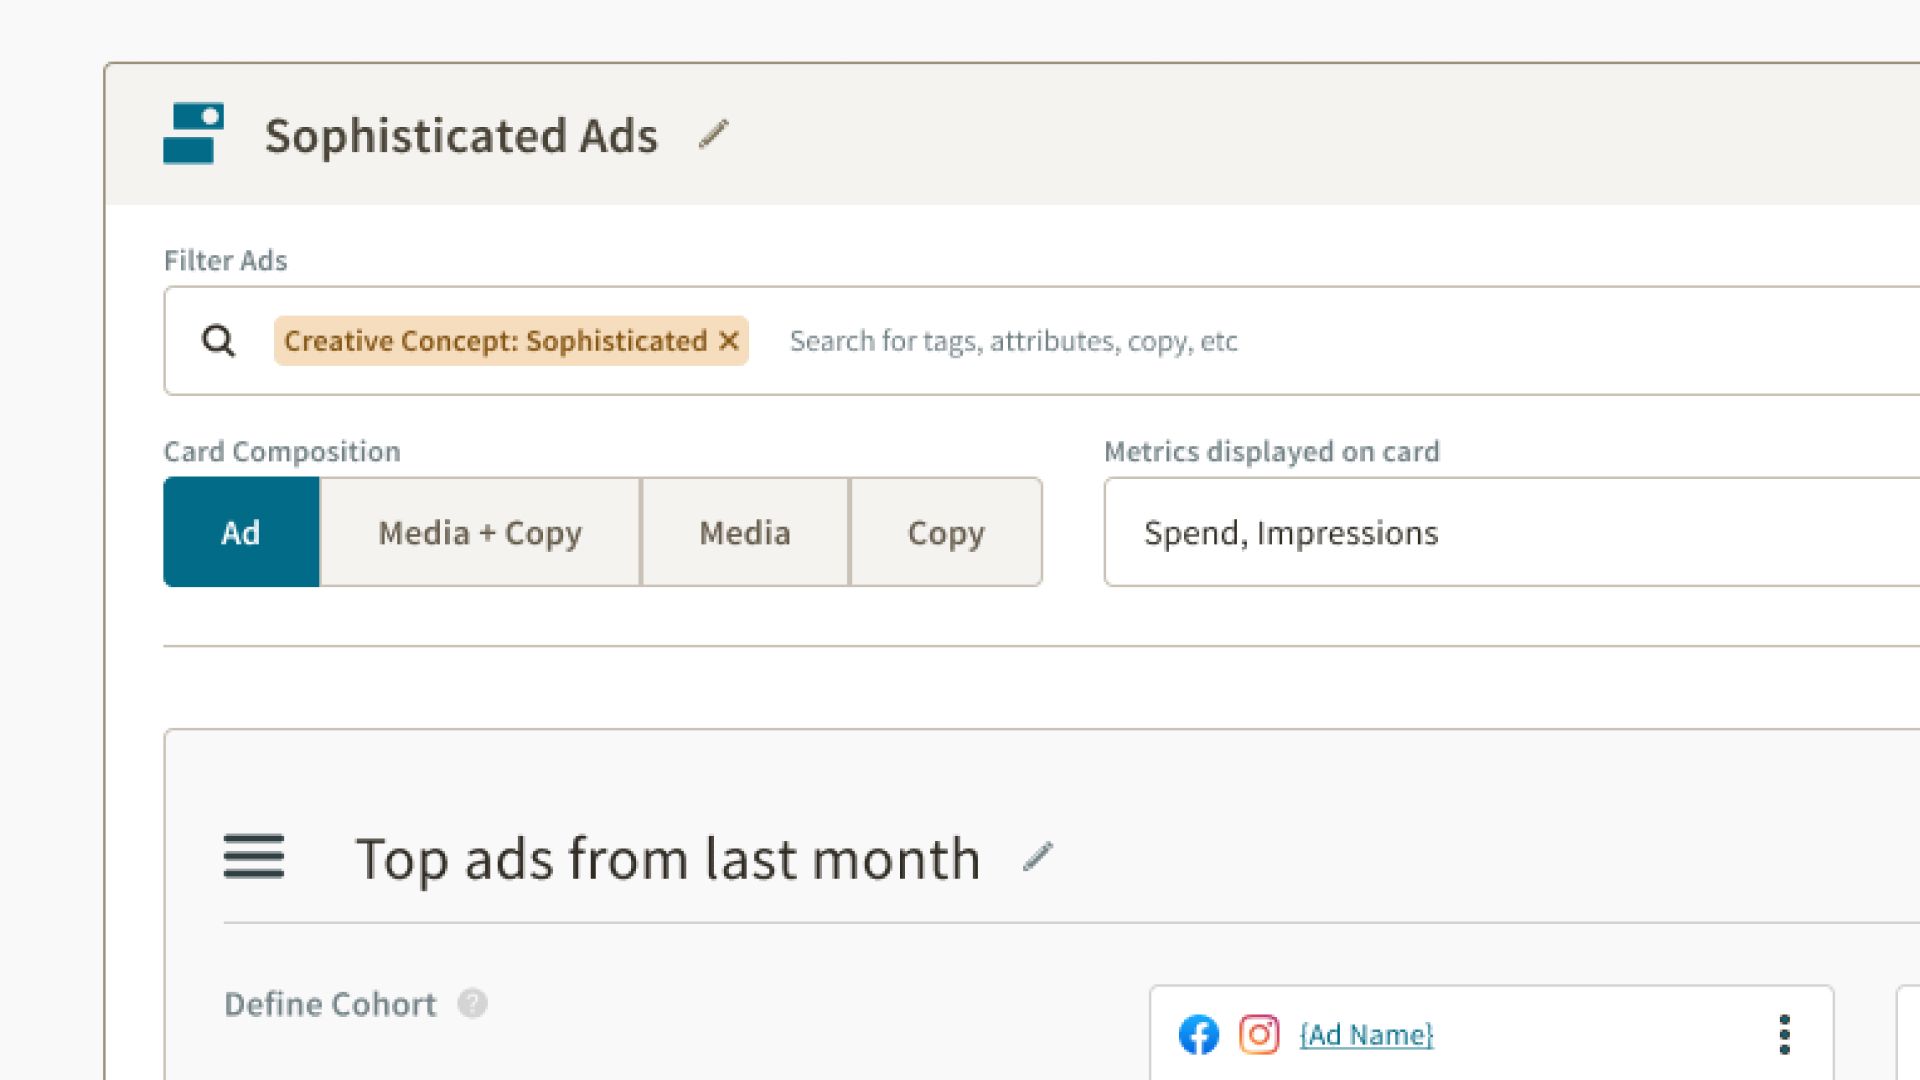
These components, combined with rich audience targeting, automated attribute tagging, a target link or product, and campaign spend make up the holistic representation of an ad. We broke down these components into a customizable tile to understand which brand strategies were most successful. This empowered marketers, brand managers, and analysts to understand and interpret what is working and why in isolation, and collectively.
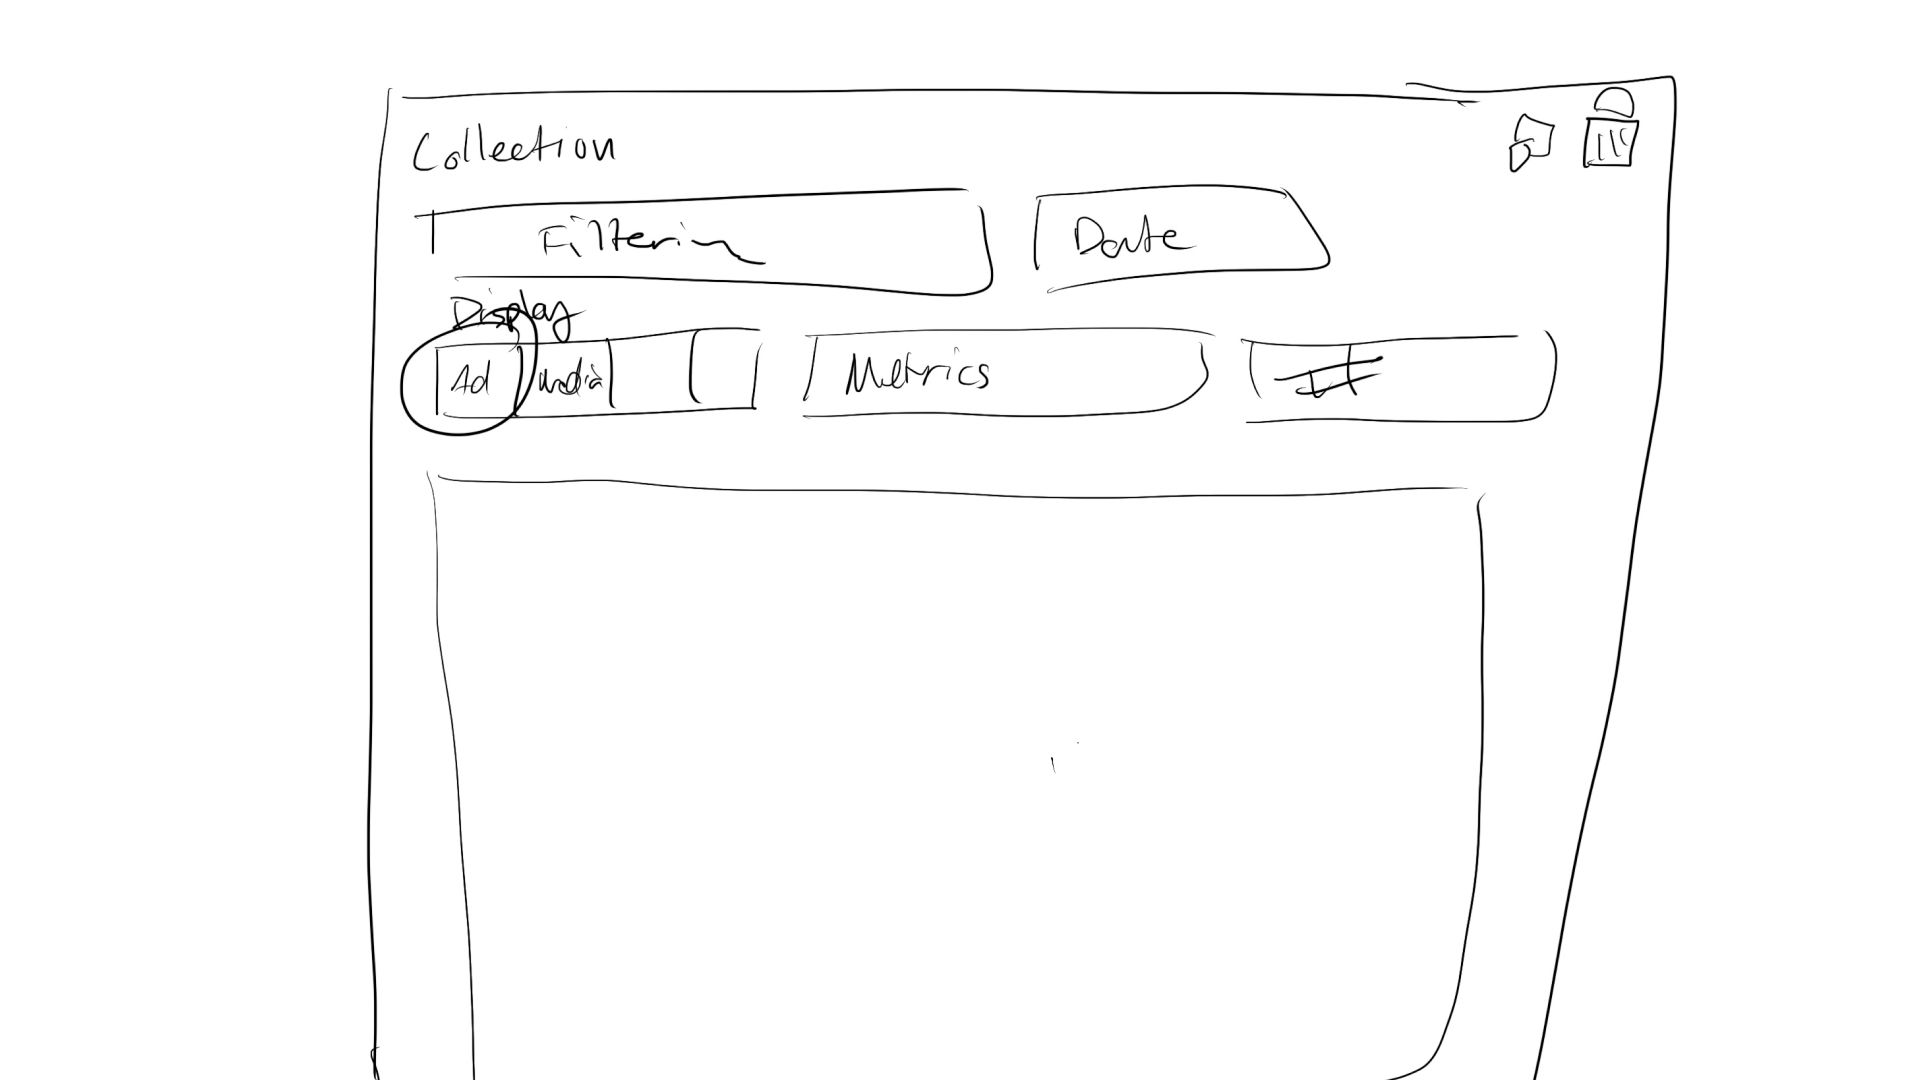
With these components identified, marketers can drill deeper into their ad creative to understand what steps to take next and make informed data-driven decisions. This is enabled by fully customizable containers and a cohesive hierarchy that target slices of advertising data based on a date range and filters to further segment your campaigns based on brand attributes, audience targeting, and brand characteristics defined by the user.
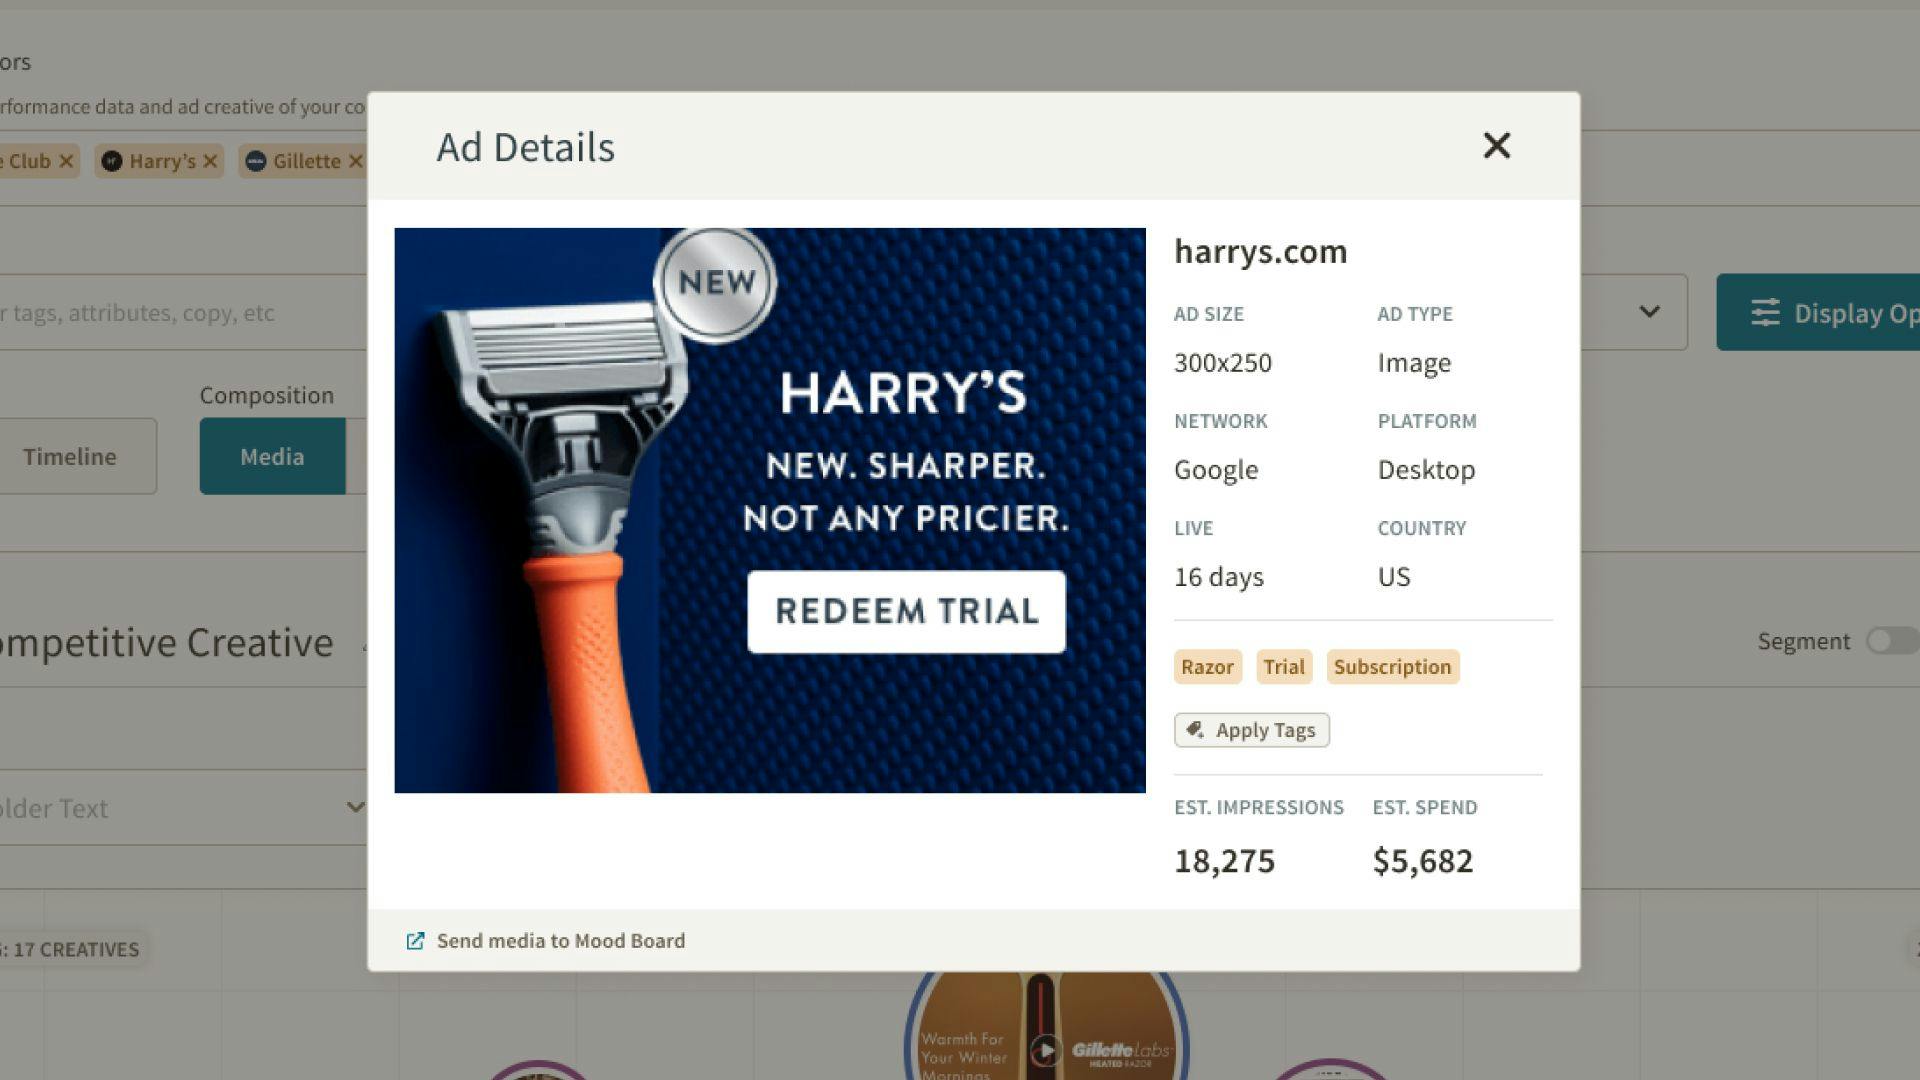
Detail Modal
Ad creative components are often used in multiple different ads. See detailed information about the ad, campaign, and other ads the creative components are referenced.
Customizable tile summary
Scrutinize ad components in a context similar to how your target audience sees them. Customize what components appear in the tile to dive deeper into specific elements of creative.
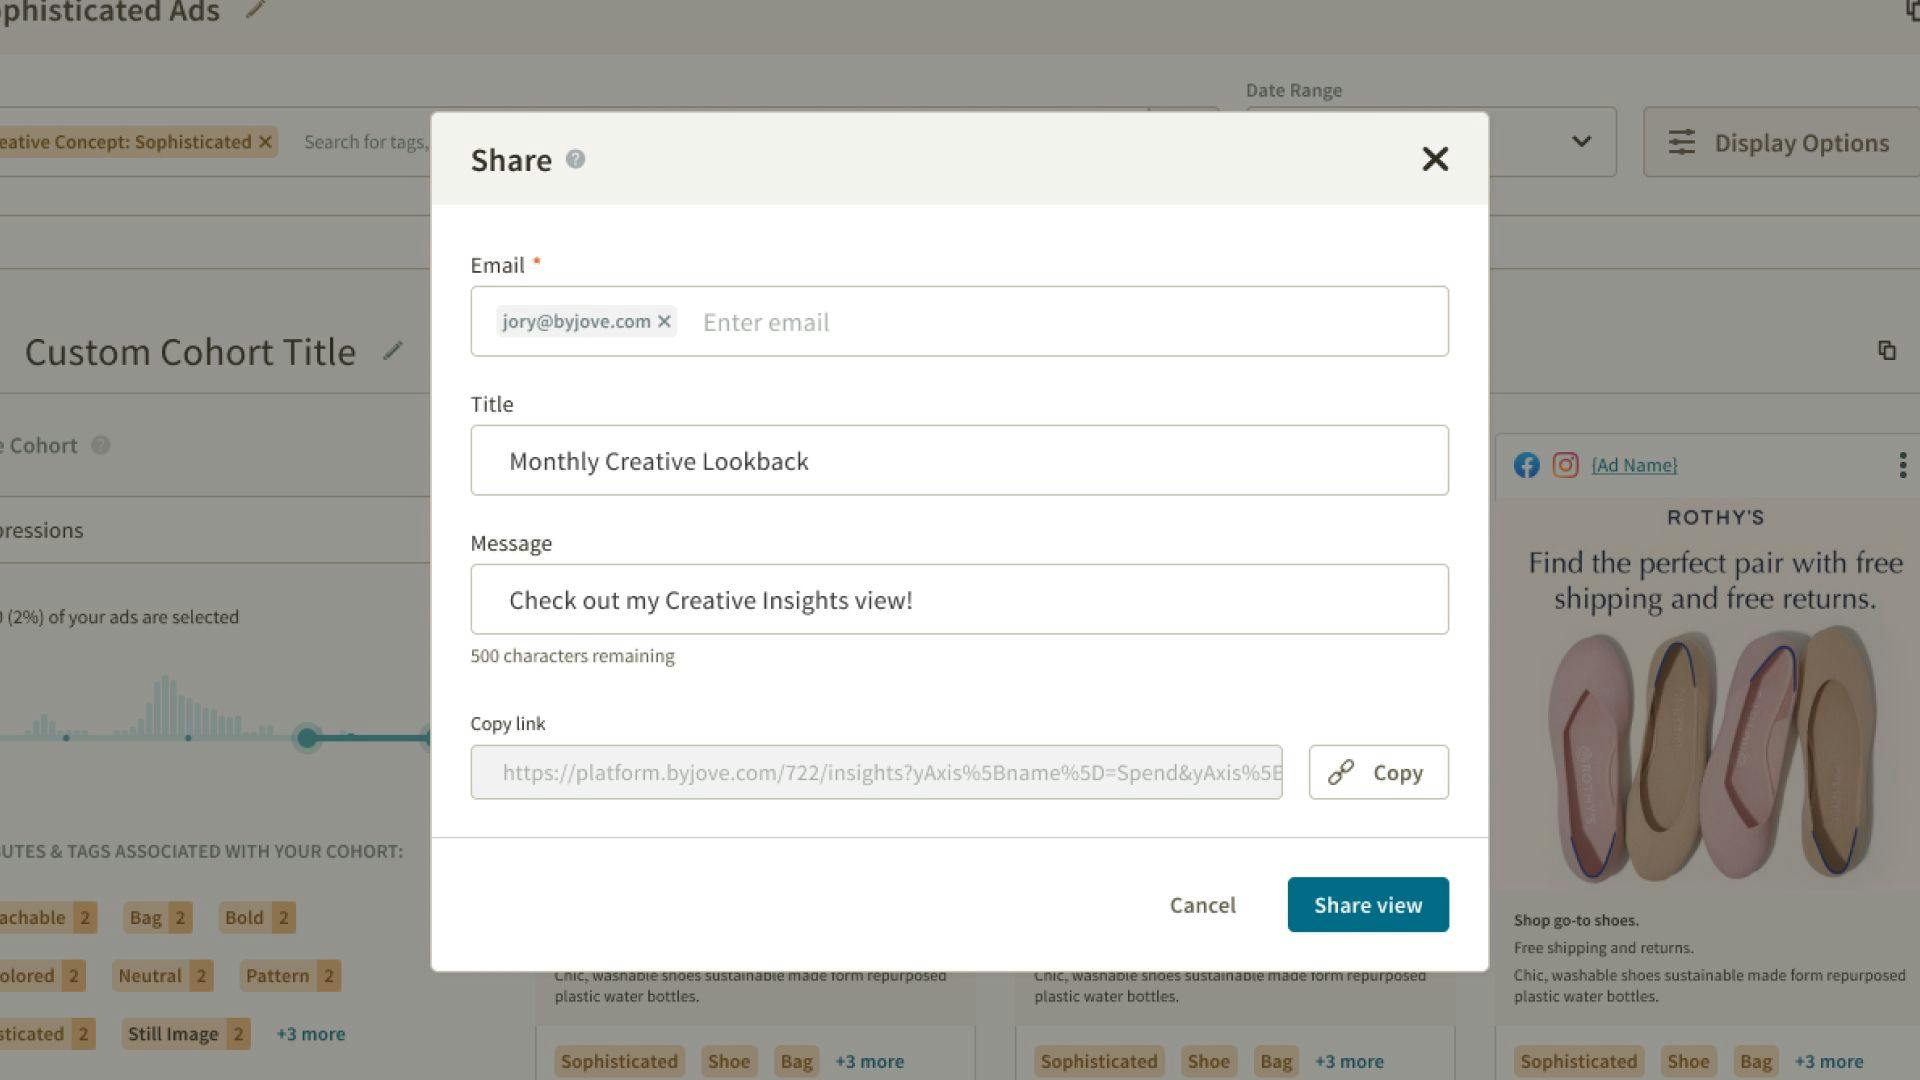
Team collaboration
Create custom, always up-to-date dashboards to collaboratively identify trends and outliers.
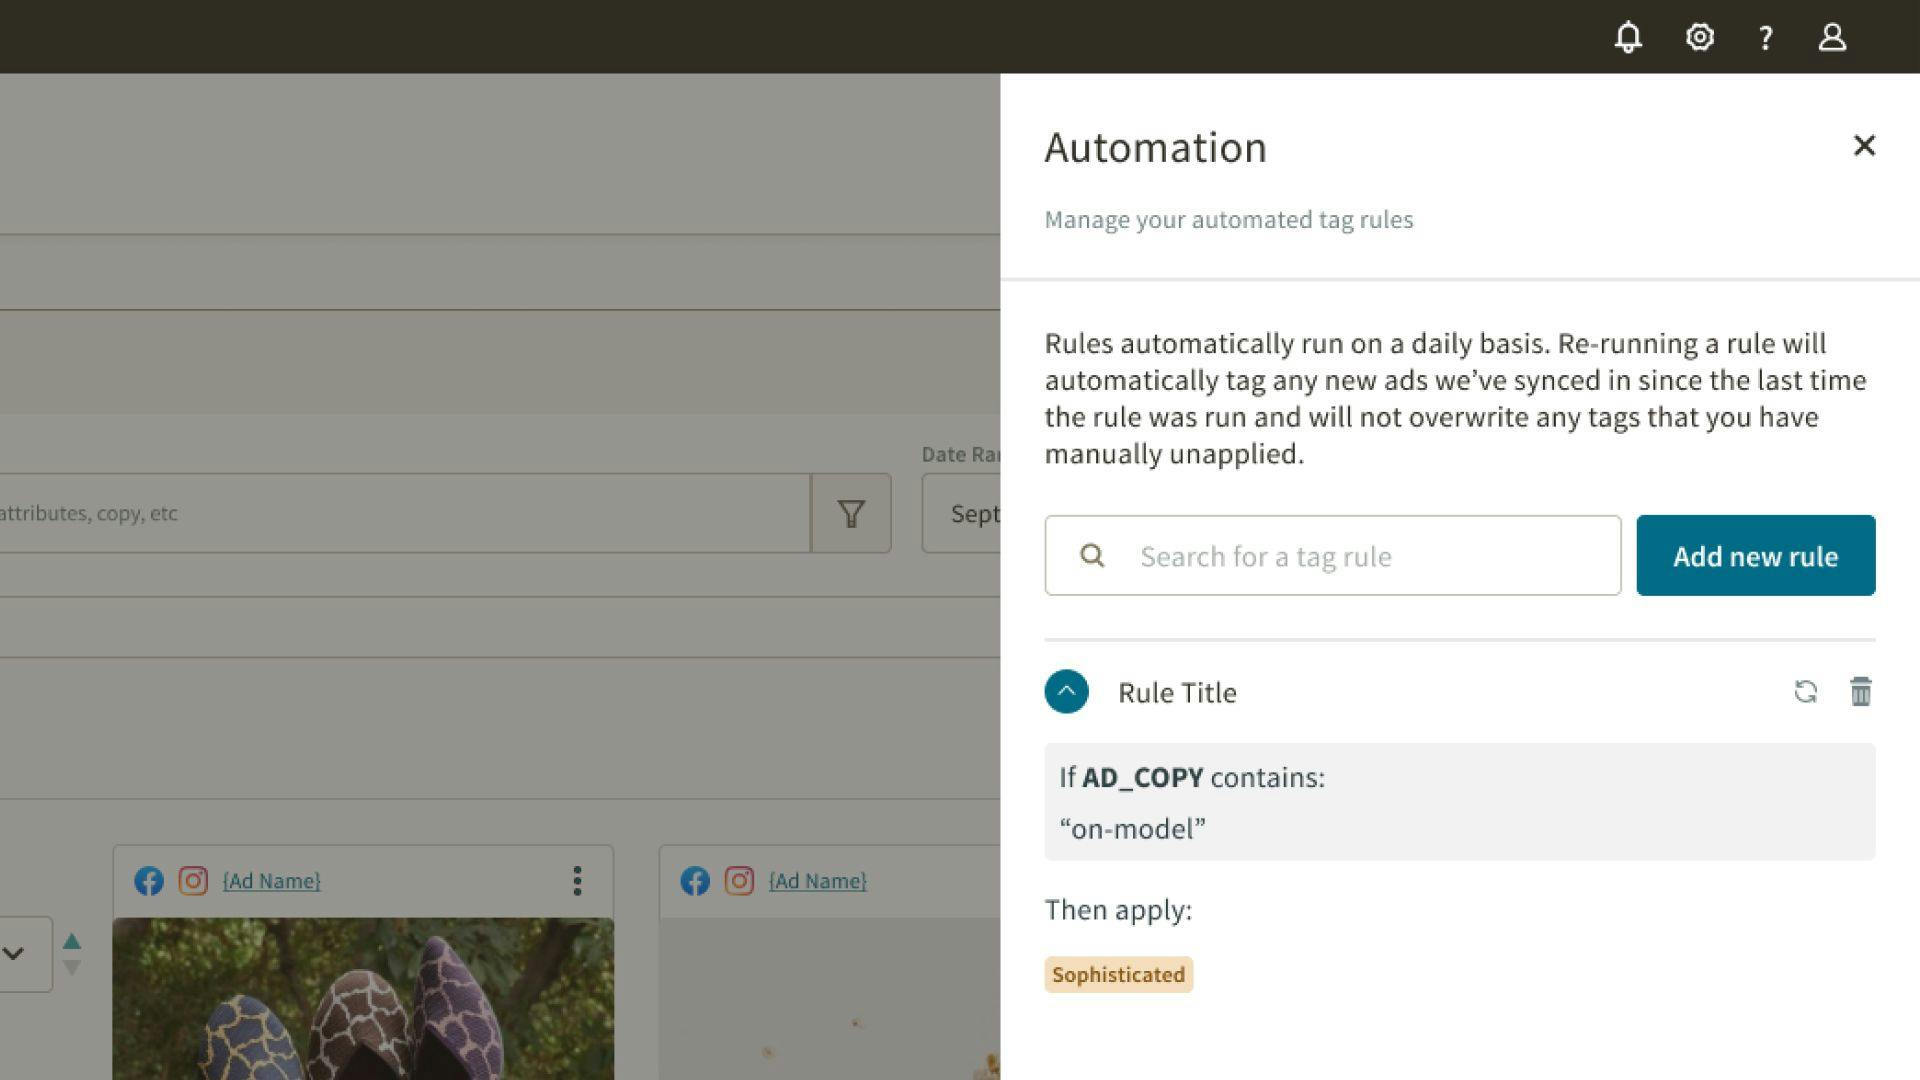
Attribute automation
Automate the creation of attributes and tags based on naming conventions, campaign structure, and audience metadata.
Filtering and search at your fingertips
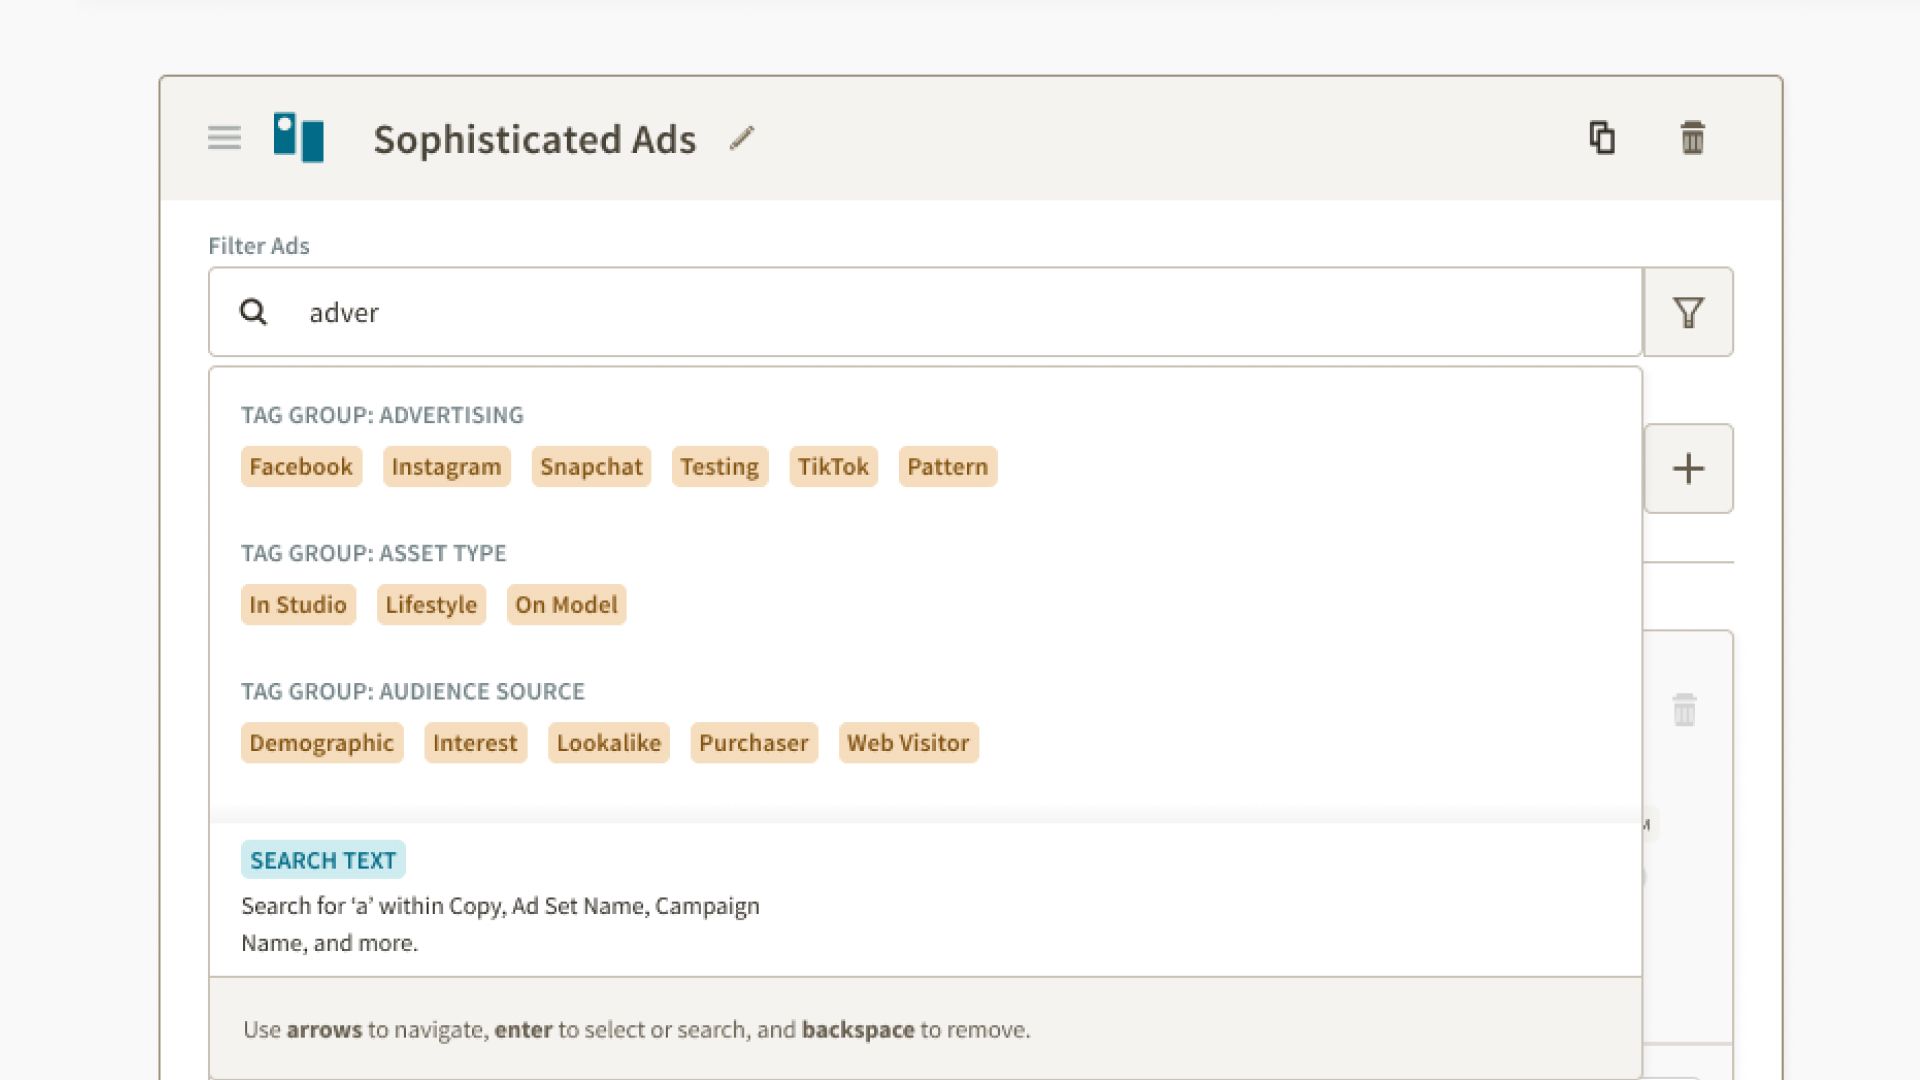
Data tied to digital advertising is complex, hyper-granular, and can be exceeding disparate between channels. The filtering experience within Creative Insights is predictive based on what the user types and surfaces attributes based on positive performance correlation.
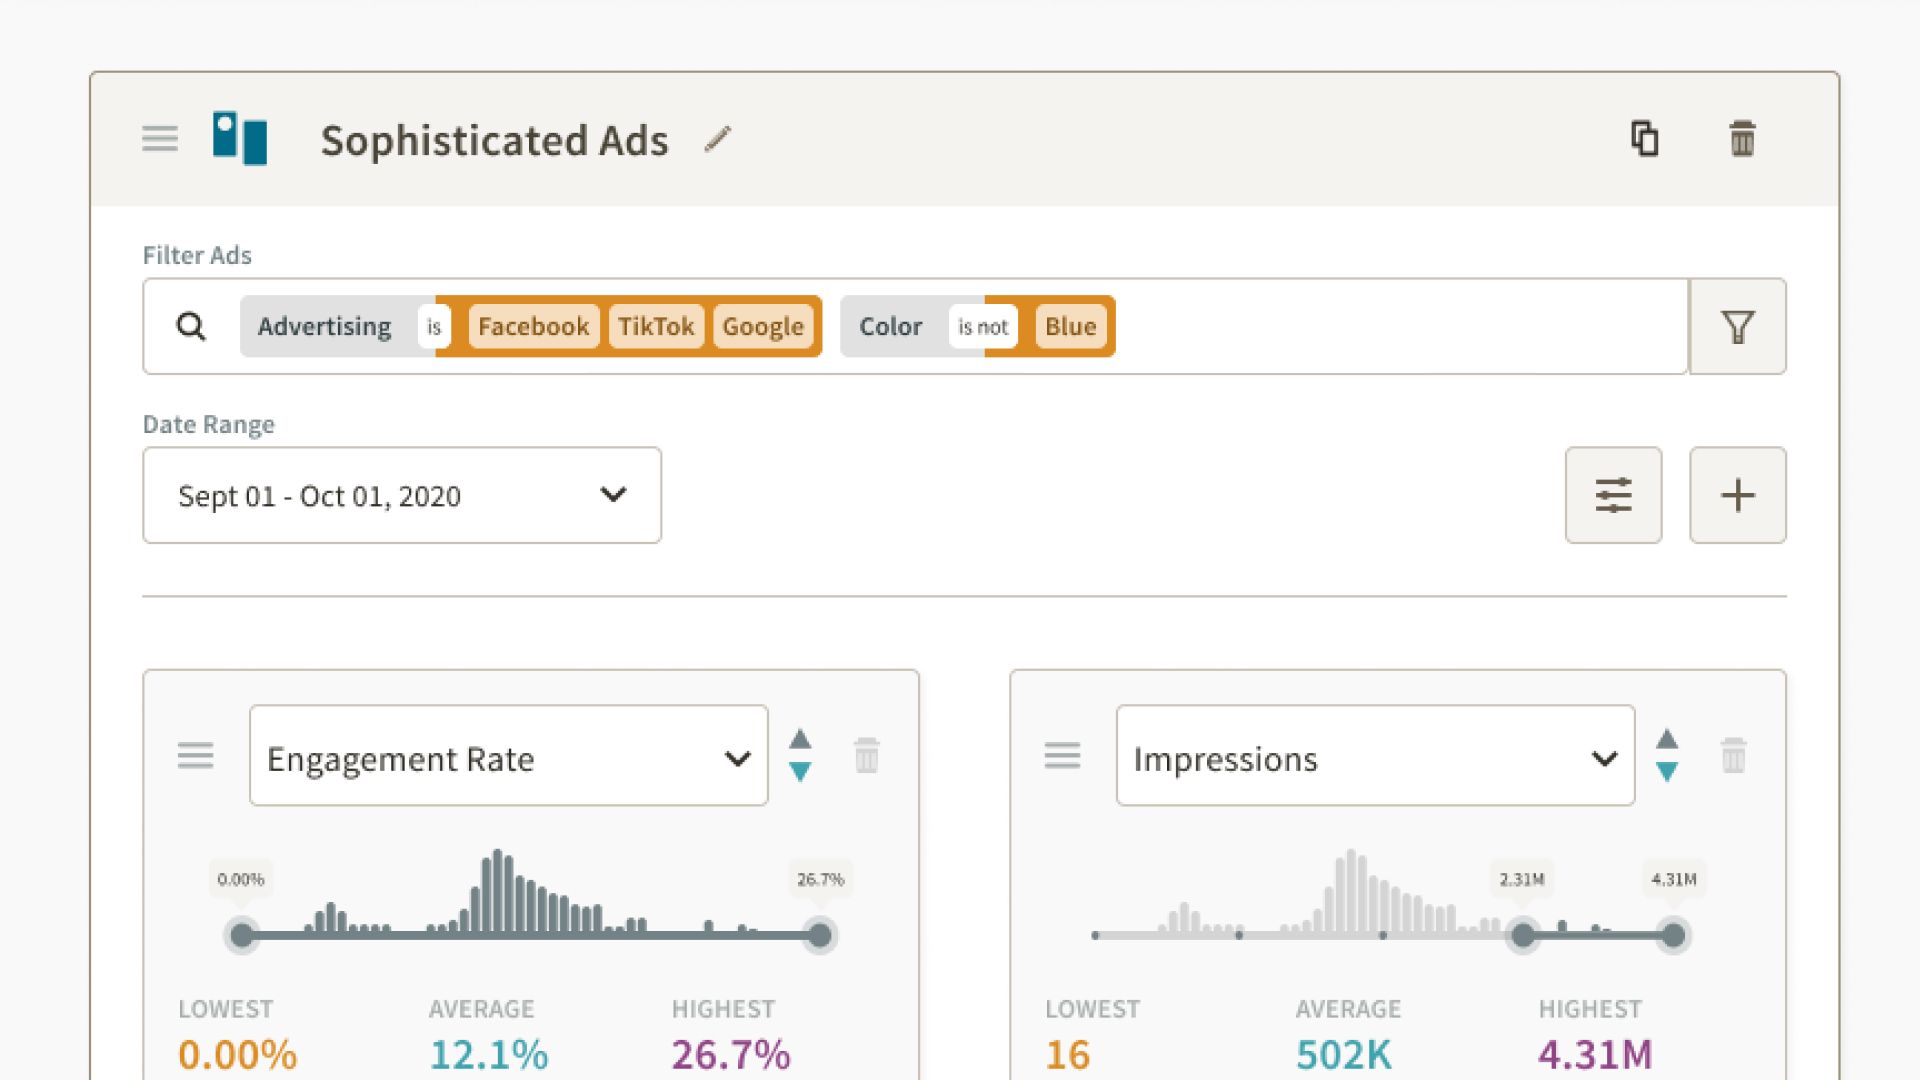
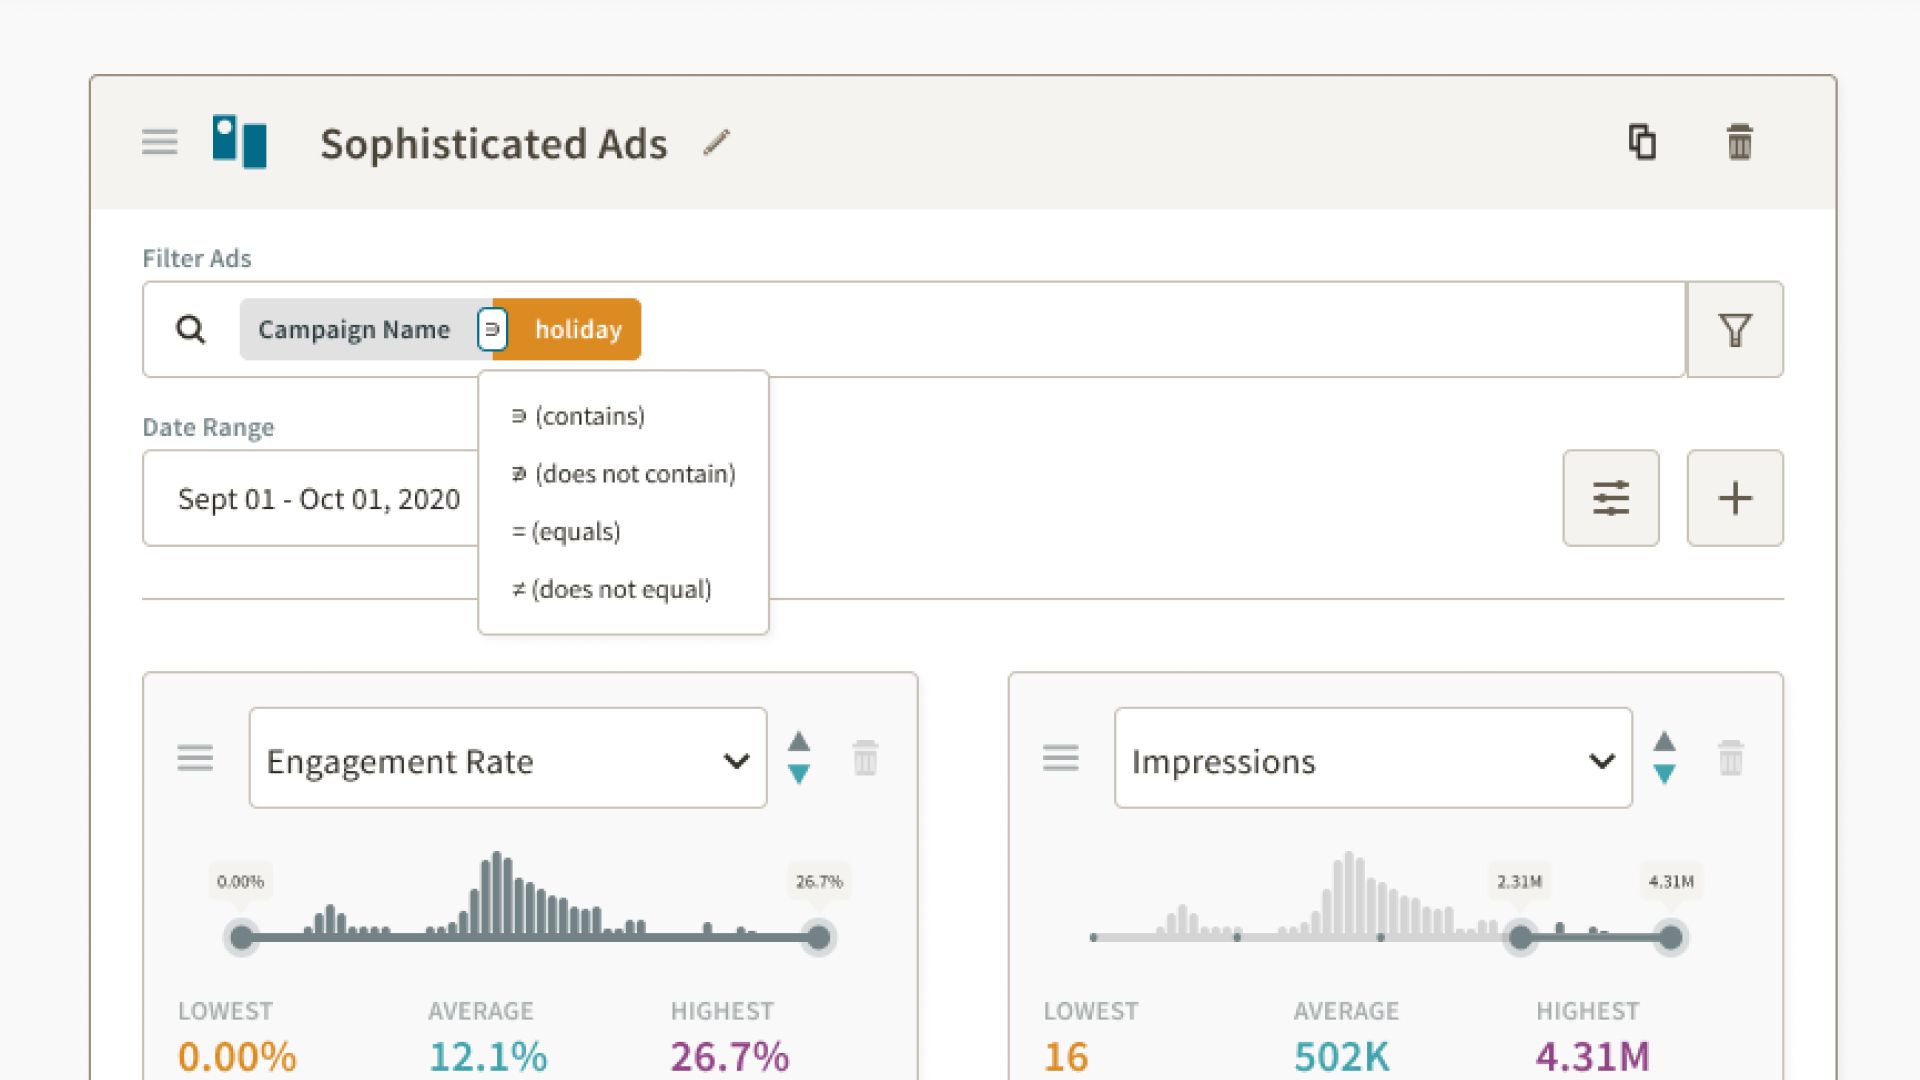
A filter group within the search field empowers users to quickly narrow their search with multiple attributes based on grouping and strategy while facilitating power users with exclusionary operators, multiple numerical operators, and set theory operators to break down string values.
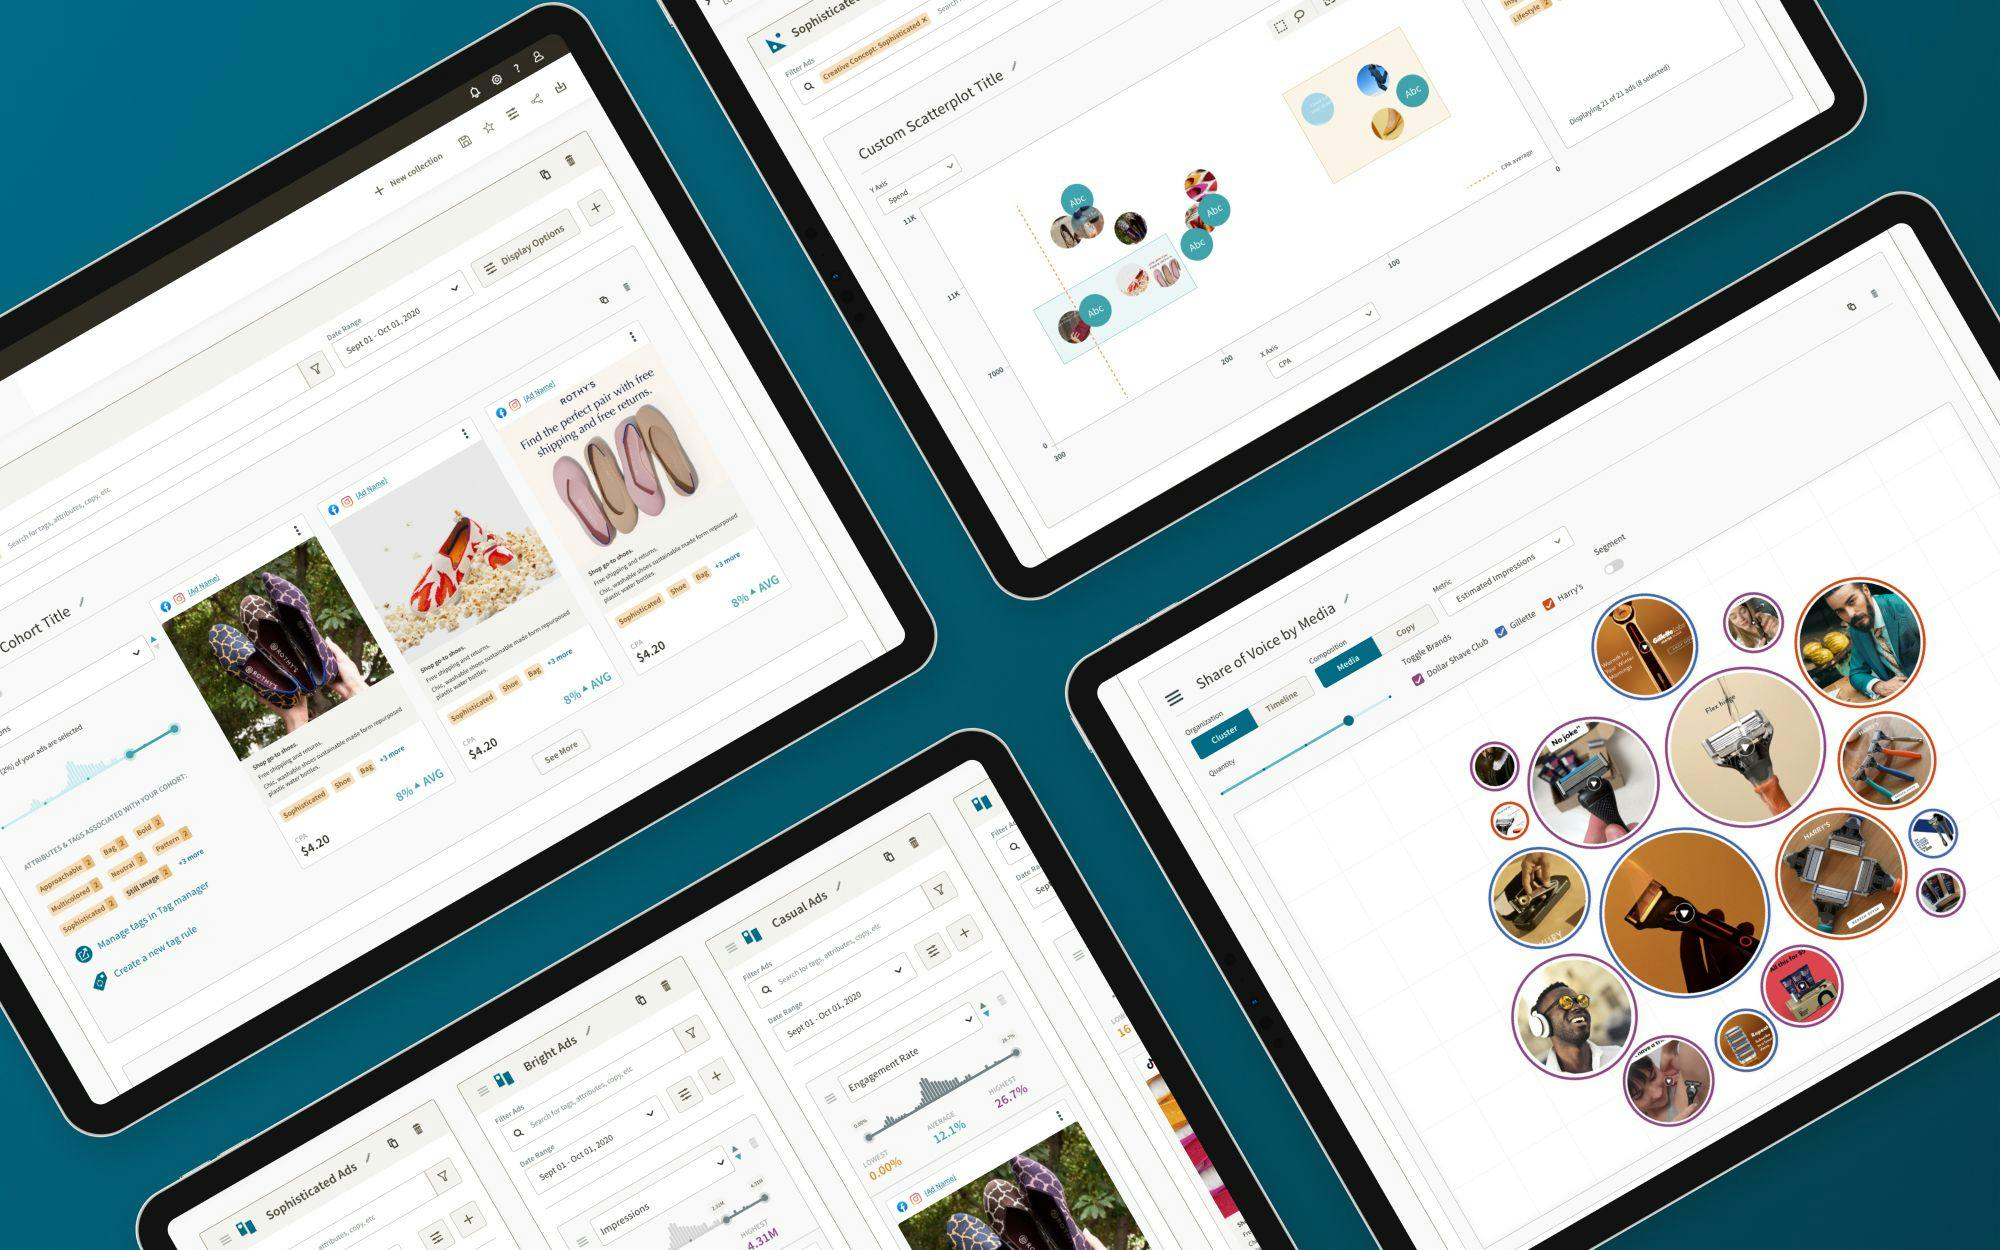
Central to the value of Creative insights is the concept of a view, or different ways to aggregate your ad performance data, understand broad trends, and dive deeper into what brand strategies resonate best with your audience. Each view renders the same slices of your ads, but each surfaces different insights and correlations based on metric comparison and sorting.
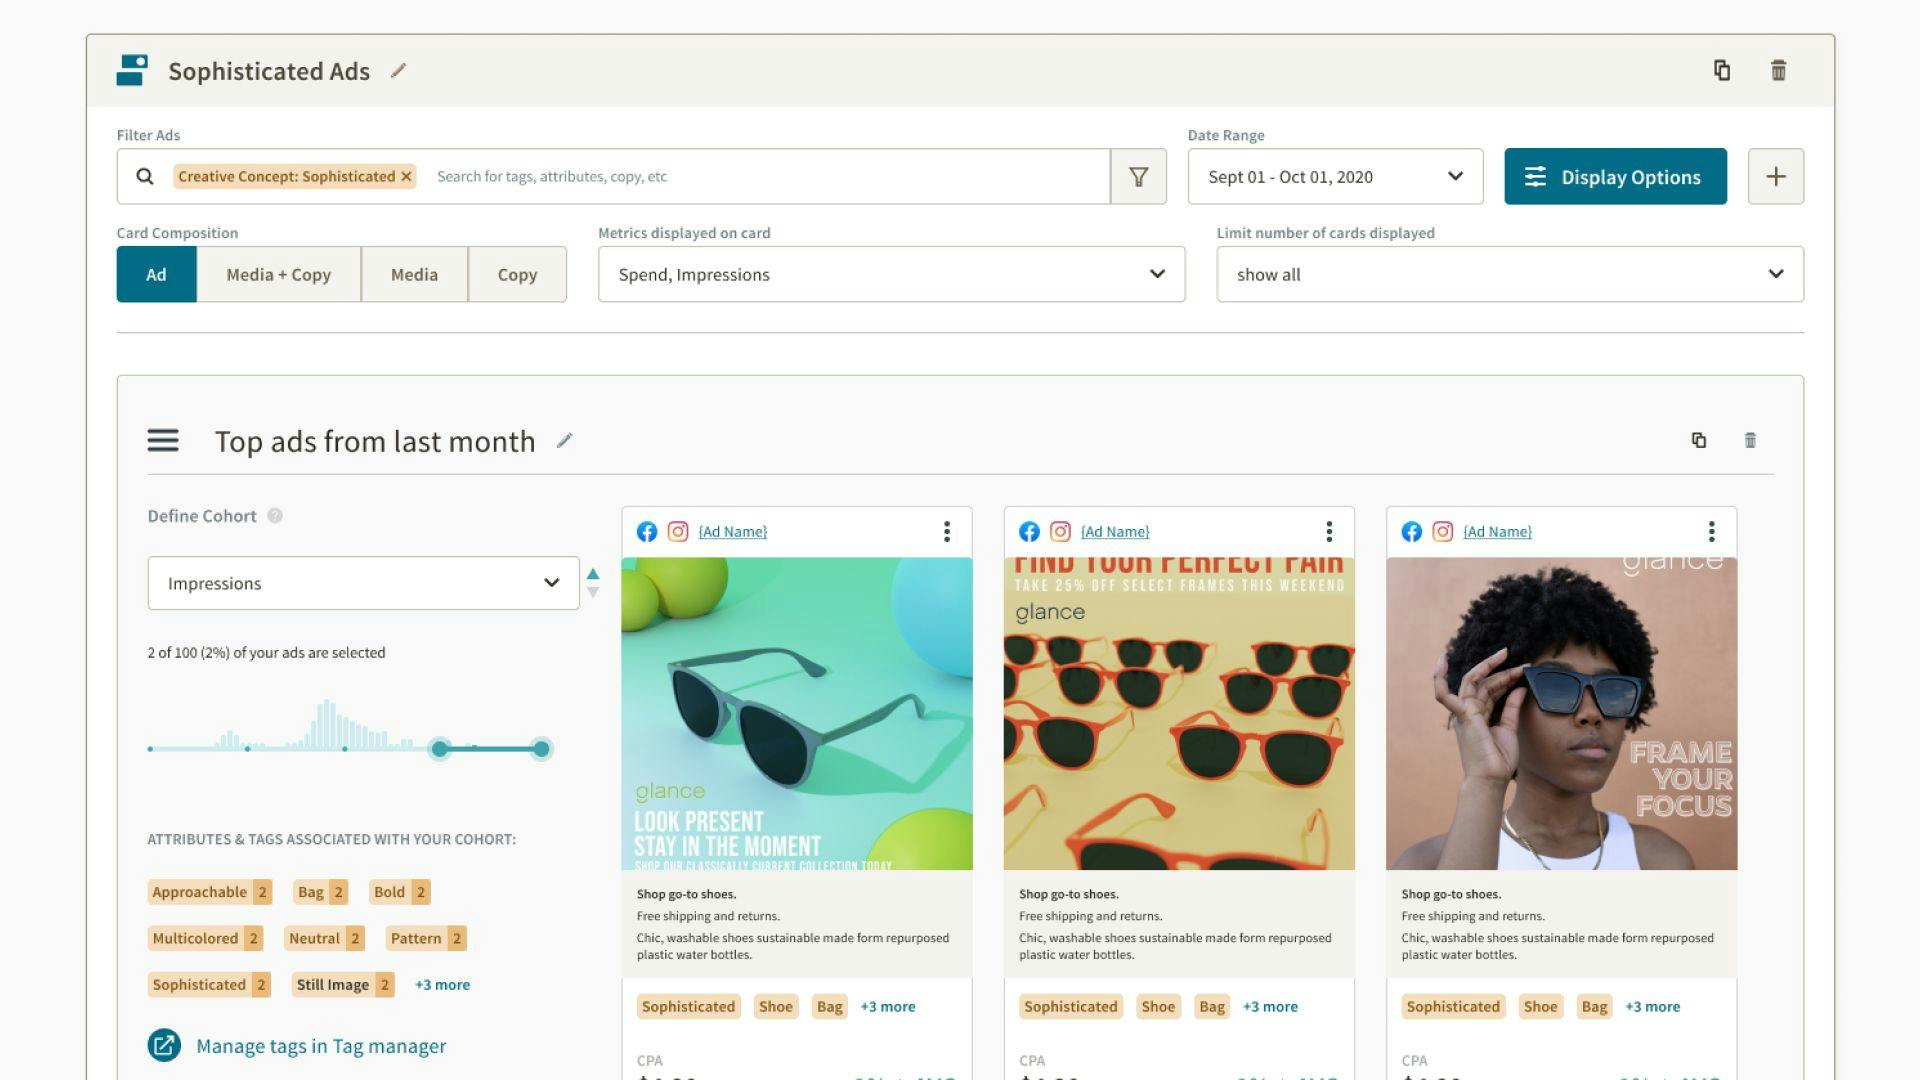
Cohort view
View slices of advertising campaigns sorted by metrics most important to the user's business goals. Understand why ads perform well based on automated analysis and user-defined brand and creative attributes.
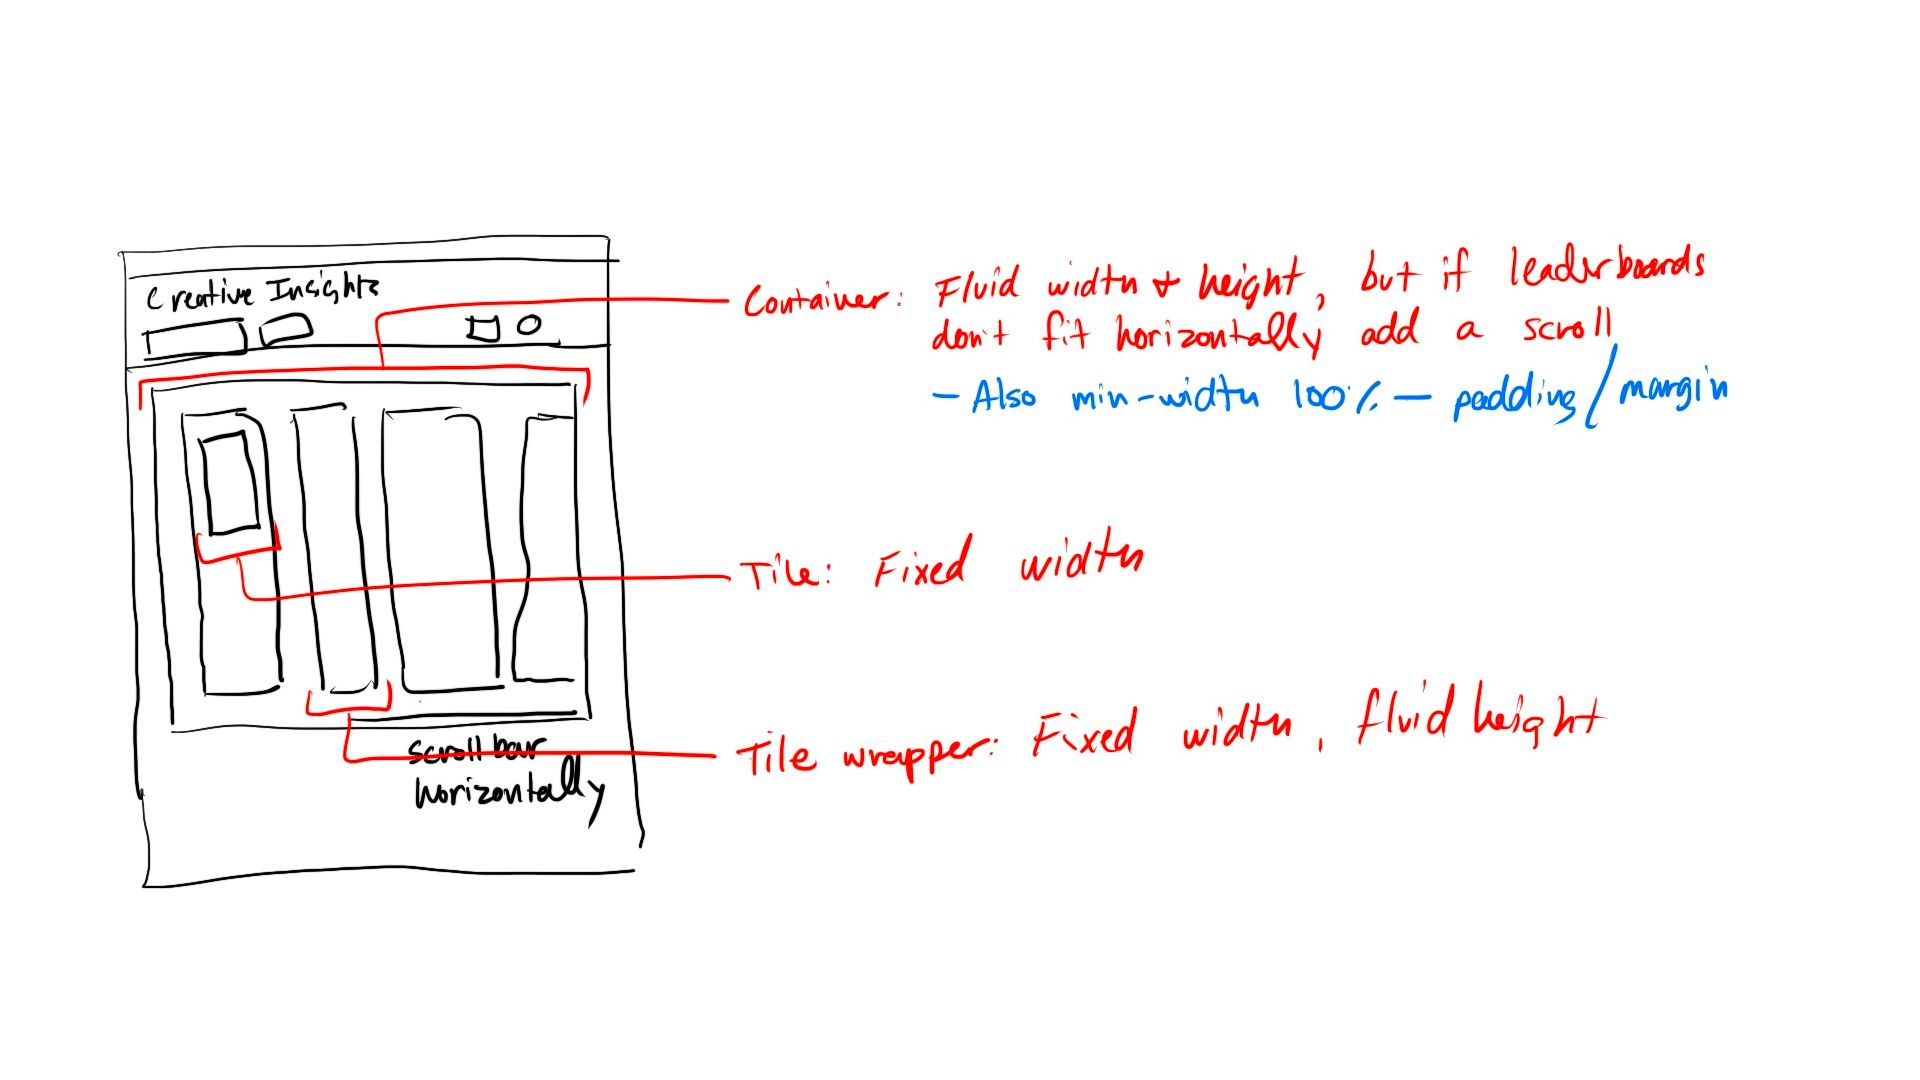
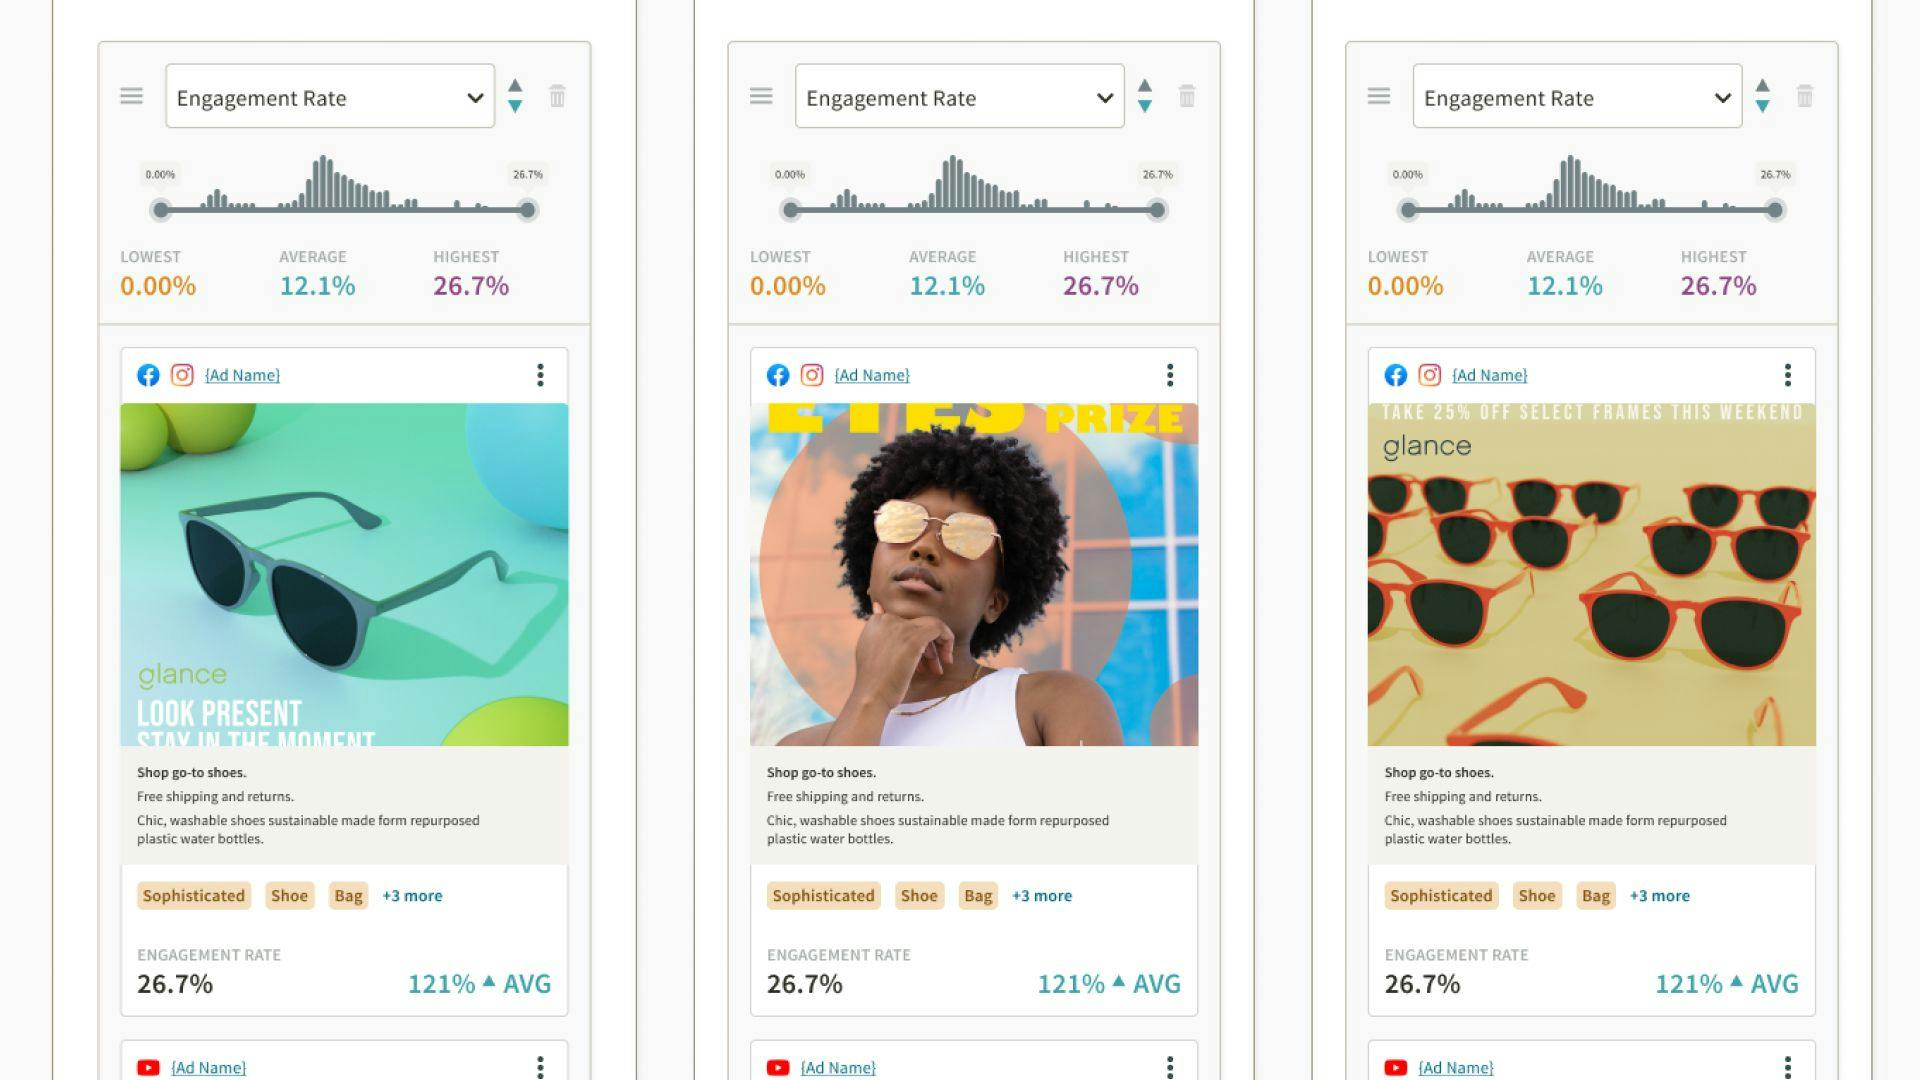
Leaderboard view
Aggregate and sort ads by multiple performance metrics to explicitly segment a marketing funnel. Compare and contrast winning ad concepts with a roll-up of key metrics.
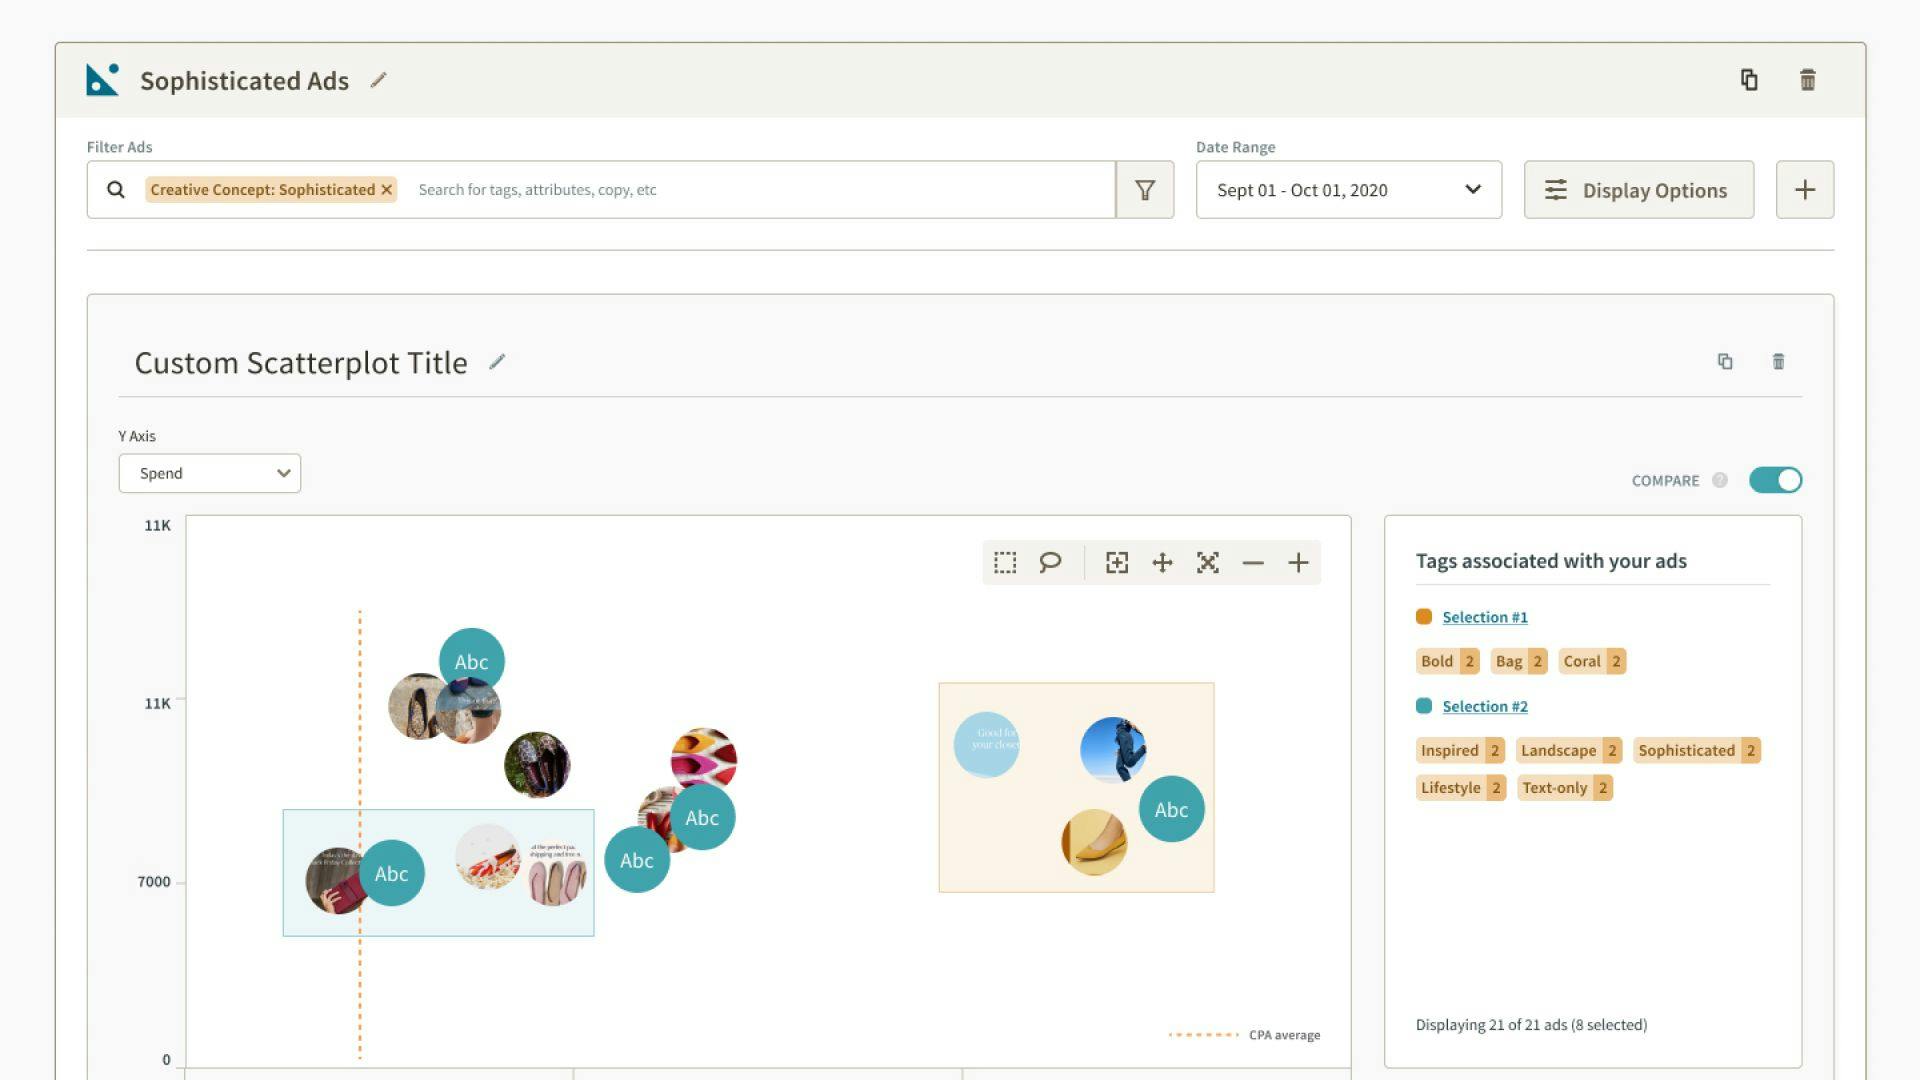
Scatterplot view
Compare ads by multiple performance metrics on a distributed axis. Define comparative segments within the scatterplot to better understand common attributes.
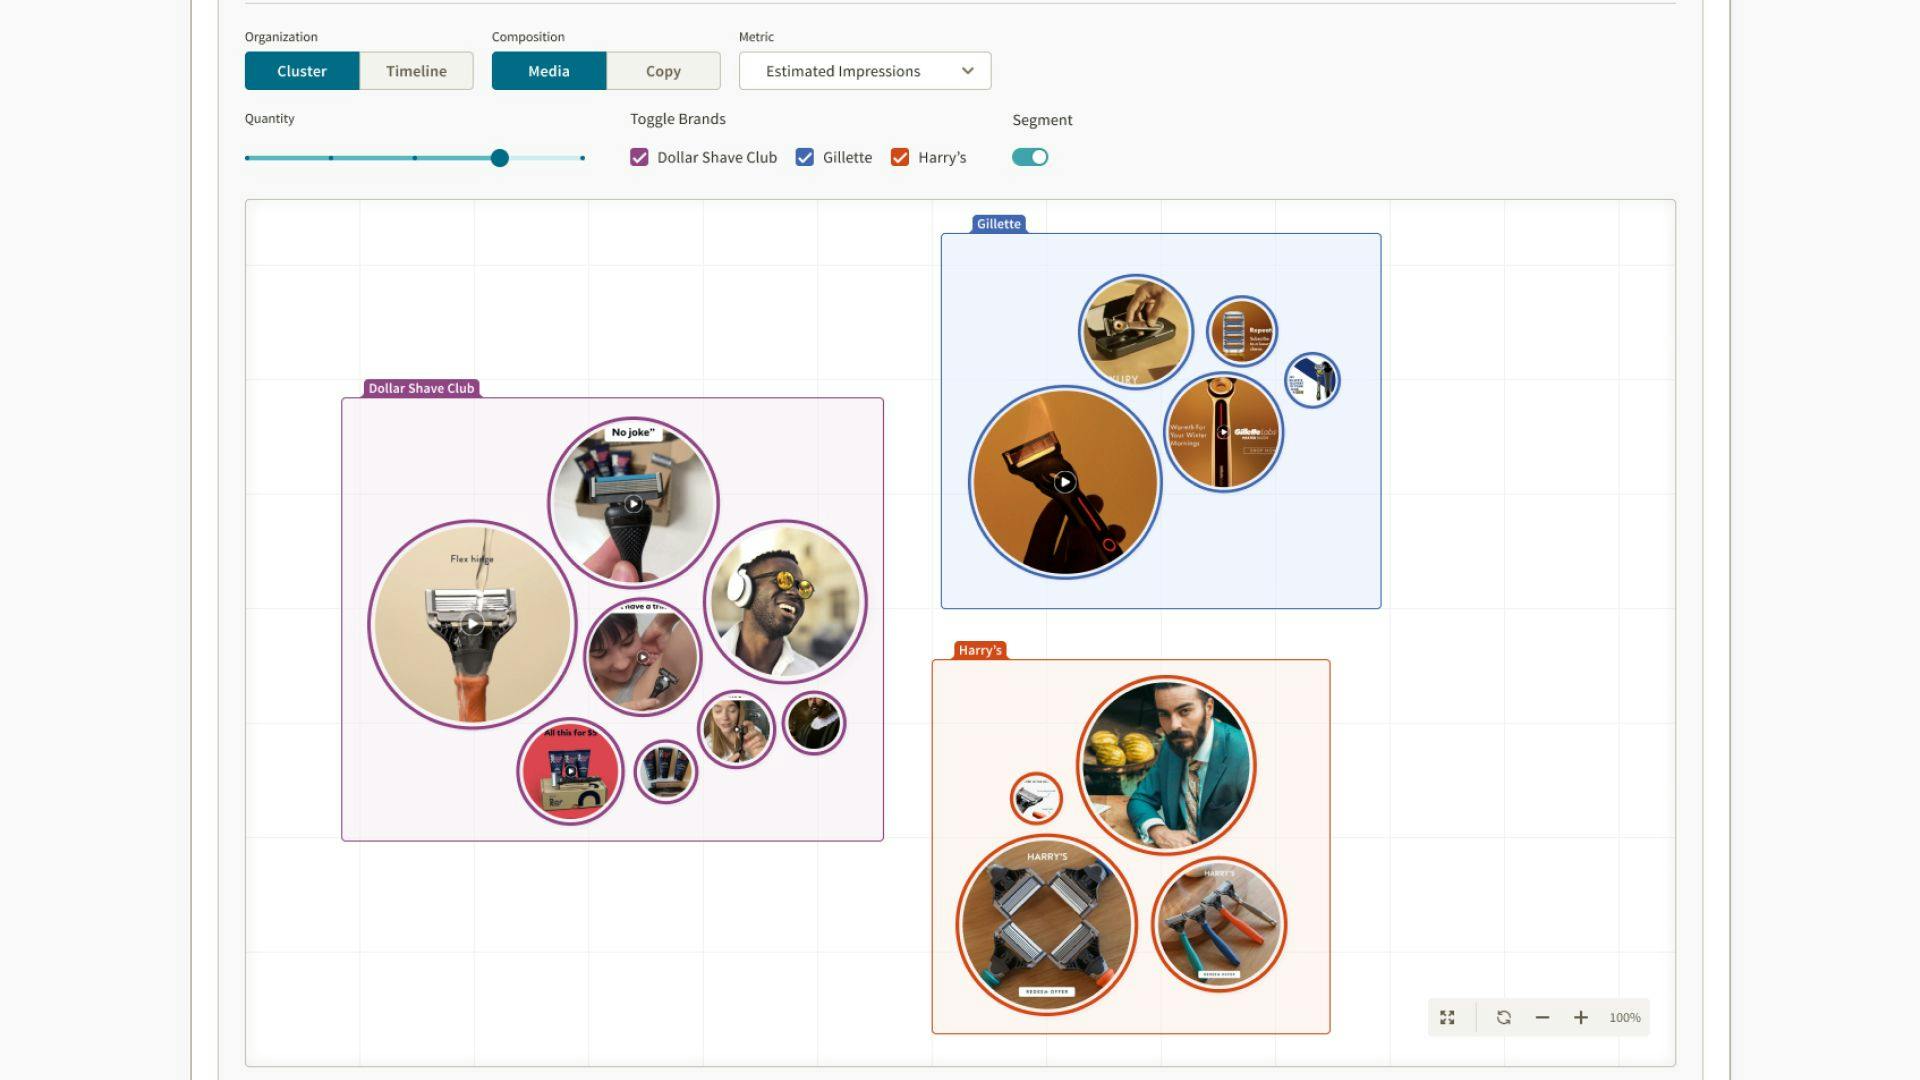
Competitive & share of voice
Define marketplace and brand segments to get a leg up on the creative strategies competitors are using. Understand broadly how much of the market competitors are capturing based on ad spend and impressions.
User research and testing
Marketers are historically the most stressed and anxiety-ridden employees in a company next to the CEO. During our planning and ideation phases, we conducted multiple user interviews and performed prototype testing with target marketers from a variety of different-sized marketing teams.
Much of the hierarchy, labeling, and elements we were planning to introduce in Creative Insights were fundamentally new in the market. We strove to understand what labels made the most sense for usability, easy organization, and completion of tasks.
Introducing as much user customization into Creative Insights as we did had the potential to confuse users and hinder them from knowing what to do or how to accomplish simple tasks. Our user research and testing identified key areas of tension in the hierarchy and organization of features and settings that drove our tooltip copy, in-platform walkthroughs with AppCues, and support documentation.
63%
Active users month-over-month
22%
Monthly recurring revenue
25%
User retention
85%
Task success rate
Based on prototype tests ran in UserTesting.
15 seconds
Average task completion time
Based on prototype tests ran in UserTesting
90% positive
Usability ratings
Based on user interviews ran in UserTesting.
Next steps
After launching the initial milestone of Creative Insights, several elements of our broader customer experience were highlighted as friction points, including key experiences like onboarding and educating the user through a fundamentally new experience.
Onboarding
Data backfilling for cross-channel marketing data is time-consuming with API rate limits and sheer volume. After launch, we noticed a drop off in new users returning to Creative Insights after they had created an account and connected their channel accounts because the data backfill can take up to 24 hours for large accounts.
Introduce more straightforward language setting expectations for the relative timeframe. We initially conducted user interviews about the data import timeframe and generally received positive feedback from users with a common sentiment that they would tolerate a 24 hour period of time to backfill their data. This ended up hindering conversions in the real world.
Highlight a broader range of educational and support content to give users a more in-depth overview of common functions and scenarios prior to their data being backfilled.
Template views
The up-front learning curve of Creative Insights presented problems for some users generally stemming from less mature marketing programs. This led us to introduce more comprehensive template views that empowered users to dive into their marketing data at different stages of their marketing funnel and understand different audience segments and brand value propositions.
These template views act as a starting point for beginning users, with more advanced users customizing the templates to meet specific business needs to share with their team.